The Economic Crisis is Over.....
Happy April Fool's Day
Stocks and Bonds were both in rally mode as we closed out the month and the first quarter yesterday. Bond markets benefited from investor fears that falling home prices coupled with weak consumer confidence would delay an economic recovery (see more below). US Equities were led higher by bank and tech stocks following some positive news from the European banking sector and a broker upgrade of Microsoft.. The World Bank also pledged its support of the US dollar as the world's reserve currency and also announced a $50billion program to support global trade after the OECD said world trade was falling at a pace of 13.2% and drastically deteriorating the global economy. It is of the utmost importance that the US not lead the world into a global depression...expect to hear more on this at the G20 summit.
TSY yields were mixed overnight but traded in a tight range. Yields are however falling early in the US session following comments from President Obama who says bankruptcy is likely for GM and Chrysler . The NIKKEI still traded up almost 3.00% overnight, European equity indices are trading marginally to the downside, and US Stock futures indicate an open 1.00% in the red.
Currently the MBS stack is relatively unchanged from 3pm close and 5pm going out levels. Falling TSY yields would generally lead MBS prices higher and mortgage rates lower...however expensive MBS dollar prices (103 handle on a 5.0!!!) are making it hard for MBS traders to push prices much higher. Depending on your prepay expectations UP IN COUPON still outperforms DOWN IN COUPON....5.0s and 5.5s are the new risky MBS purchases as 104/105 handles on 6.0s and 6.5s are deemed too chancy given uncertain borrower refinance behavior. The Federal Reserve continues to provide liquidity for production MBS/current coupon MBS sellers (the loan you write).
FN30_______________________________
FN 4.0 -------->>>> +0-00 to 100-18 from 100-18
FN 4.5 -------->>>> +0-00 to 102-05 from 102-05
FN 5.0 -------->>>> -0-01 to 103-05 from 103-06
FN 5.5 -------->>>> -0-01 to 103-24 from 103-25
FN 6.0 -------->>>> -0-01 to 104-13 from 104-14
GN30_______________________________
GN 4.0 -------->>>> +0-00 to 100-21 from 100-21
GN 4.5 -------->>>> +0-01 to 102-08 from 102-07
GN 5.0 -------->>>> +0-00 to 103-22 from 103-22
GN 5.5 -------->>>> +0-01 to 104-03 from 104-02
GN 6.0 -------->>>> +0-00 to 104-15 from 104-15
Yesterday's News....
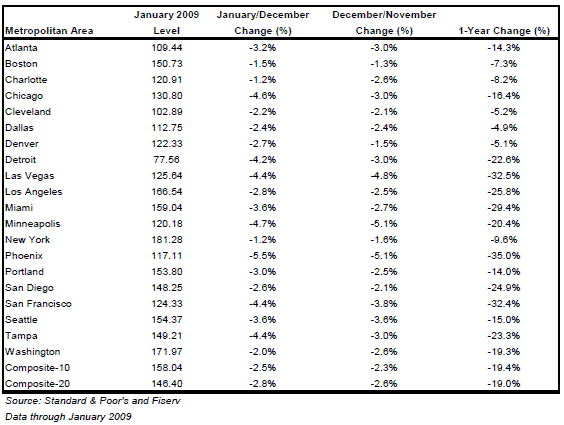
According to the S&P/Case Shiller...data through January 2009 "shows continued broad based declines in the prices of existing single family homes across the United States, with 13 of the 20 metro areas showing record rates of annual decline, and 14 reporting declines in excess of 10% versus January 2008."
City by City break down of Home Depreciation. Note the January/December Change. The pace of price depreciation actually PICKED UP in January!!!

This long standing and trusted economic release conflicts data released by the Federal Housing Finance Agency on March 24. Remember the FHFA reported that, for January 2009, US home prices rose by 1.7% and year over year home prices fell by only 6.3%.
Odd contradiction isn't it?
Housing supply still overwhelms housing demand by enormous amount...foreclosures have been put on pause by the GSEs which helps supply/demand technicals, but the huge gap between supply and demand implies home prices need to continue to fall before buyers return to the market. In order for home prices to bottom, consumers need to feel confident that home prices have hit bottom before returning to the market. Well in order for consumers to feel confident that home prices have hit bottom people need to start buying homes. In order for people to start buying home consumers need to feel confident that home prices have hit bottom. Wait...uh oh...sounds like we are in a bit of a quandary.
The bigger problem is now rising unemployment...if consumers don't have jobs they don't have income. What happens if GM goes bankrupt..morejob losses...UGH right? This is the textbook depiction of a downward economic spiral....this is why the Obama Administration's budget deficit will grow into the 2020's. Remember that following wars and economic downturns our domestic debt-to-GDP ratio has historically grown. Well...this crisis is twice as bad because not only are we dealing with massive government spending from an expensive War...we are working through the worst post-WWII economic crisis. Its twice as bad. Read More on GM HERE.


