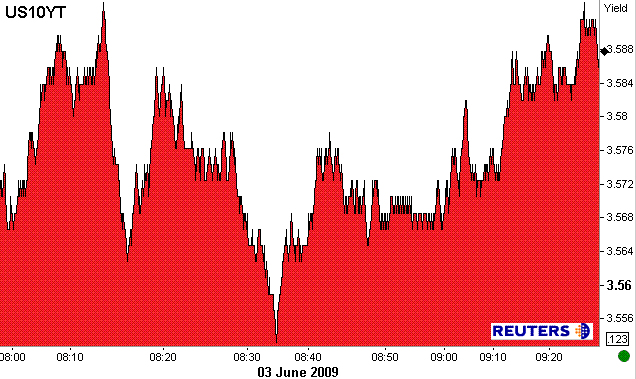
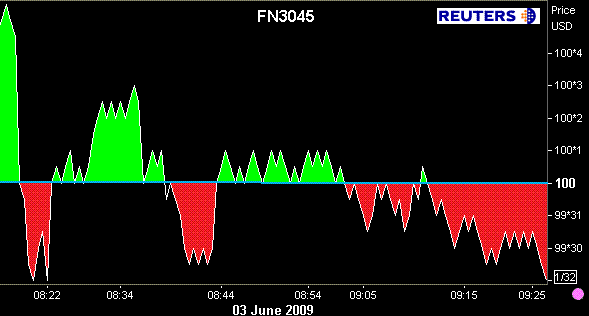
ADP Employment data was in line with expectations....the market now turns their speculative focus to the release of Non-Farm Payroll data on Friday. Since the ADP data release...
The 10yr has bounced around a range between 3.56% and 3.59%...

....while the FN 4.5 ventured into par territory for a moment before falling victim to par-nertia (originators and servicers have been sellers when FN4.5 ventures over 100-00)

Stock futurees indicate an open to the downside....the market appears to be teetering on a tipping point...as in do traders push stocks higher or do they re-evaluate the exuberence exhibited in the recent equity index run ups.
Again...all is dependent upon jobs data to come...
REMEMBER: Until a new bias is formed in the bond market.....MBS price behavior will be moderated by the gyrations of the yield curve
At 10am we get April Factory Orders (+0.9% vs -0.9% in March) and May Non-Manufacturing ISM (45 vs. 43.7 in April). Also at 10AM Fed Chairman Bernanke will be testifying before the House Budget Committee RE: the Economy and Financial Conditions. All three events have the potential to move money in short term...but market's main focus remains on....JOBS DATA!!!! That said we would expect volatility to continue to calm as we get closer to the release of Non-Farm Payrolls on Friday...lowers vols= good thing for "Rate sheet influential" MBS...
This morning the Fed is buying TSY notes maturing between 2016 and 2019...those are MBS influential maturites.
2s/10s: 263 bps
6/2 EFFECTIVE FED FUNDS: -0.01 to 0.20 from 0.21
LIBOR FIXINGS
O/N LIBOR: +0.0000 to 0.2612 from 0.2612
1 MONTH: -0.0012 to 0.3187 from 0.3200
3 MONTH: -0.0094 to 0.6369 from 0.6463
6 MONTH: -0.0263 to 1.2075 from 1.2337
1 YEAR: -0.0237 to 1.5838 from 1.6075
ADP
-532,000 vs. street's expectation for -520,000. Prior print was revised to -545,000 from -491,000
Here is the ADP PRESS RELEASE...
Nonfarm private employment decreased 532,000 from April to May 2009 on a seasonally adjusted basis, according to the ADP National Employment Report®. The estimated change of employment from March to April was revised by 54,000, from a decline of 491,000 to a decline of 545,000.
Monthly employment losses in April and May averaged 539,000. This is a notable improvement over the first three months of the year, when monthly losses averaged 691,000. Nevertheless, despite some recent indications that economic activity is stabilizing, employment, which usually trails overall economic activity, is likely to decline for at least several more months, although perhaps not as rapidly as during the last six months.
May's ADP Report estimates nonfarm private employment in the service-providing sector fell by 265,000. Employment in the goods-producing sector declined 267,000, with employment in the manufacturing sector dropping 149,000, its thirty-ninth consecutive monthly decline.
Large businesses, defined as those with 500 or more workers, saw employment decline by 100,000, while medium-size businesses with between 50 and 499 workers declined 223,000. Employment among small-size businesses, defined as those with fewer than 50 workers, declined 209,000. Since reaching peak employment in January 2008, small-size businesses have shed 2,125,000 jobs.
In May, construction employment dropped 108,000. This was its twenty-eighth consecutive monthly decline, and brings the total decline in construction jobs since the peak in January 2007 to 1,345,000. Employment in the financial services sector dropped 32,000, the eighteenth consecutive monthly decline.
The Mortgage Bankers Association Weekly Mortgage Applications Survey for the week ending May 29, 2009
The Market Composite Index, a measure of mortgage loan application volume, was 658.7, a decrease of 16.2 percent on a seasonally adjusted basis from 786.0 one week earlier. This week's results include an adjustment to account for the Memorial Day holiday.
The Refinance Index decreased 24.1 percent to 2953.6 from 3890.4 the previous week and the seasonally adjusted Purchase Index increased 4.3 percent to 267.7 from 256.6 one week earlier.
The four week moving average for the seasonally adjusted Market Index is down 9.0 percent. The four week moving average is up 0.3 percent for the seasonally adjusted Purchase Index, while this average is down 12.0 percent for the Refinance Index.
The refinance share of mortgage activity decreased to 62.4 percent of total applications from 69.3 percent the previous week. The adjustable-rate mortgage (ARM) share of activity increased to 3.0 percent from 2.6 percent of total applications from the previous week.
The average contract interest rate for 30-year fixed-rate mortgages increased to 5.25 percent from 4.81 percent, with points decreasing to 1.02 from 1.28 (including the origination fee) for 80 percent loan-to-value (LTV) ratio loans. The 44 basis point increase in the 30-year rate was the largest since a 48 basis point increase in October 2008.
The average contract interest rate for 15-year fixed-rate mortgages increased to 4.8 percent from 4.44 percent, with points decreasing to 1.10 from 1.16 (including the origination fee) for 80 percent LTV loans.
The average contract interest rate for one-year ARMs increased to 6.61 percent from 6.55 percent, with points increasing to 0.15 from 0.12 (including the origination fee) for 80 percent LTV loans.


