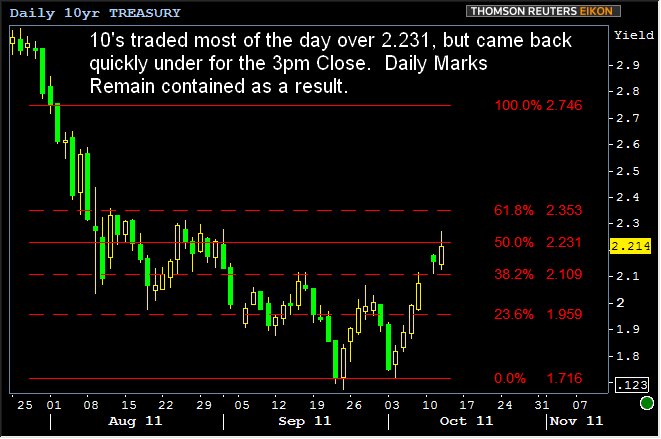
Lets take a look at how the recent action affects the longer term charts. Today ended on an interesting note on several fronts. Earlier this morning, we took a look at a 10yr chart that had 2.231 as the 50% retracement between 8/1/11 on the high end and September closing lows on the other end. After looking almost certain to hit the 3pm close at a higher yield than 2.231, 10's came surging back to get the daily mark within the technical level. Rather than serve as a sort of bullish indication, this feels more like "buying time" in the decision to hold support or drift higher.

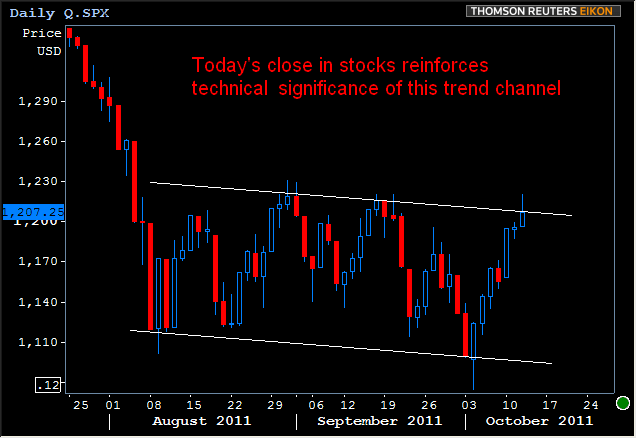
Similar story in stocks. The following chart shows a trend channel based on some very high volume lows from early August and Early October as well as some highs from late August and mid-September. But there hadn't been any recent highs to confirm this channel. UNTIL TODAY. Stocks looked certain to close above the upper trendline pictured below, but came back within the channel by closing time. A very technical move both for stocks and bonds.

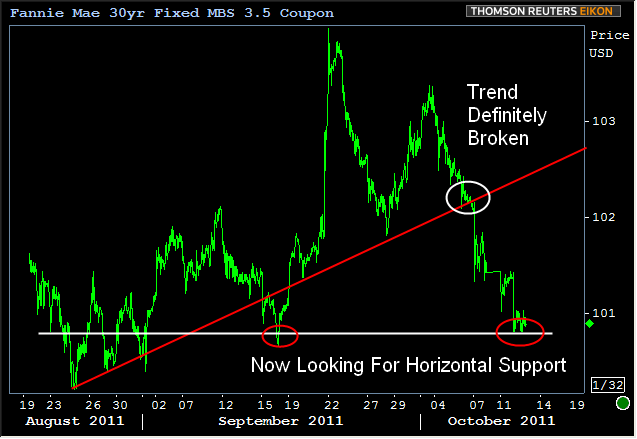
MBS continue to sort of mind their own business, seemingly less phased than their bond-market brethren by the weakness. While it's clear that the previous bullish channel is broken, MBS are now searching for some horizontal support and have a decent enough candidate for that in 100-23/100-28 area. Remember, that "good support candidate" doesn't mean it will hold, but that IF it breaks, that's a better than average indication of a shifting trend (in that case, a negative shift, probably a good short term lock signal).


