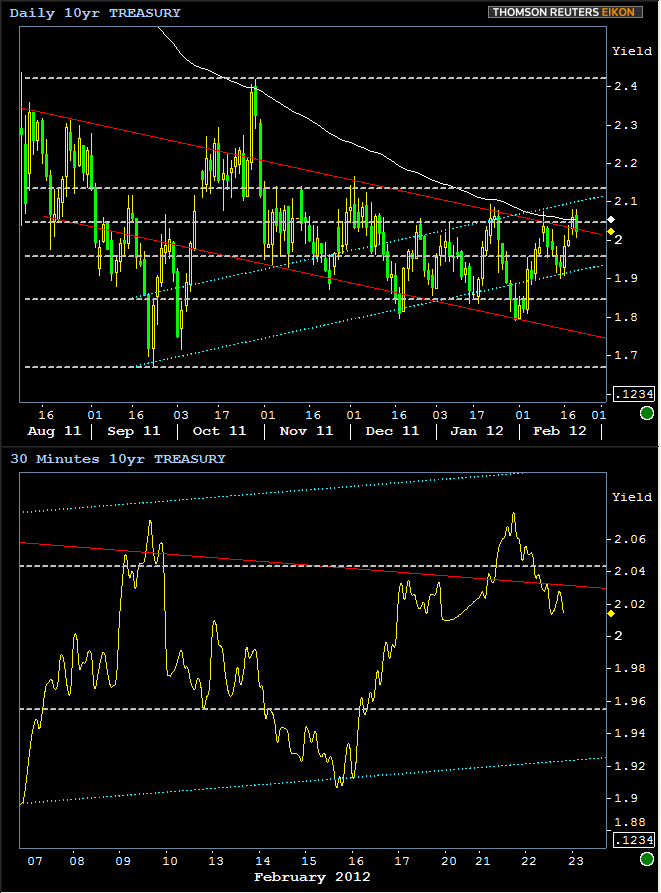
From a technical standpoint, the past few sessions have been a fairly gloomy scene for MBS and Treasuries--our two representatives from those camps being Fannie 3.5 30yr Fixed MBS and good old 10yr Treasury Notes. The technical gloominess should be fairly evident in the upper sections of each chart below. In short, both MBS and 10's had moved weaker beyond the limits of long-term trend channels and were at risk of breaking beyond horizontal levels as well.
For Fannie 3.5's, the first major break of a horizontal level at 103-10 was seen Friday on an intraday basis, but prices made it back by the end of the day. Yesterday's trading suggested the breakout more firmly as prices fell to the next major pivot around 103-00. It was (and still is) up to today's price action to reiterate or refute that move. With the current strength, prices are now in position to close at 103-10 or higher; a potentially good technical development for MBS. Note in the expanded view in the bottom section of the chart that prices are also attempting to stay within the long term trend channel support indicated by the red line.

In similar fashion, although on a slightly different schedule, Treasuries had also been threatening a break above very significant levels indeed. Not only did recent weakness in 10yr yields carry them above the supportive line of the long term trend channel (red line), but also suggested a break of the 50% retracement level between the highs and lows since August 2011. This afternoon's rally is beginning to make the latter part of February look a lot like the latter part of January with respect to these aggressive tests of the 2.04+ retracment level. As you can see in the zoomed-in version of the chart, there was a supportive bouncing against the trend-channel support today, another positive development and a fairly important counterpoint to recent threats of breakouts in an unfriendly direction.


