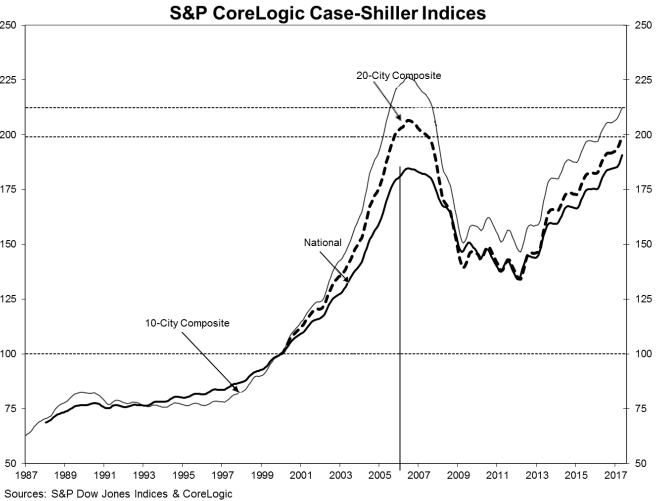
The S&P CoreLogic Case-Shiller National Home Price Index hit another new record in May, the sixth consecutive month it did so while the Federal Housing Finance Agency reported another increase in its annual Housing Price Index (HPI)
Case-Shiller's National index, which covers all nine U.S. census divisions, rose 5.6 percent on an annual basis, the same increase it posted in April. The index is now at 190.61, besting last month's record high of 180.50. On a month over month basis, the index gained 1.0 percent on a non-seasonally adjusted (NSA) basis (it rose 0.9 percent in April) and was 0.2 percent higher on an adjusted (SA) basis.
The 10-City Composite Index had an annual increase of 4.9 percent compared to 5.0 percent a month earlier. On a month-over-month basis it rose 0.7 percent before adjustment but was unchanged on an adjusted basis.
The 20-City Composite ticked down slightly to 5.7 percent from the 5.8 percent April increase. There was an 0.8 percent month-over-month change before adjustment and 0.1 percent afterward. Economists had expected the 20-City to be unchanged from April and were looking for 0.9 percent and 0.3 percent increases NSA and SA respectively. Econoday, along with its analyst estimates, commented, "Case-Shiller prices topped out early in the year and have been moderating since. The consensus for the 20-city adjusted index is only 0.3 percent in May, the same gain as April. May is a busy month for home sales and is reflected in the consensus for the unadjusted monthly index."
Seattle had, by far, the largest annual increase among the 20 cities, 13.3 percent. Portland followed with 8.9 percent and Denver took back third place with a 7.9 percent gain, bumping Dallas to fourth. All 20 cities reported month-over-month increases in May before seasonal adjustment; 14 cities afterward. Nine cities reported greater price increases in the year ending May 2017 versus the year ending April 2017.
"Home prices continue to climb and outpace both inflation and wages," says David M. Blitzer, Managing Director and Chairman of the Index Committee at S&P Dow Jones Indices. "Housing is not repeating the bubble period of 2000-2006: price increases vary across the country unlike the earlier period when rising prices were almost universal; the number of homes sold annually is 20 percent less today than in the earlier period and the months' supply is declining, not surging. The small supply of homes for sale, at only about four months' worth, is one cause of rising prices. New home construction, higher than during the recession but still low, is another factor in rising prices.
"For the last 19 months, either Seattle or Portland, Oregon was the city with fastest rising home prices based on 12-month gains. Since the national index bottomed in February 2012, San Francisco has the largest gain. Using Census Bureau data for 2011 to 2015, it is possible to compare these three cities to national averages. The proportion of owner-occupied homes is lower than the national average in all three cities with San Francisco being the lowest at 36 percent, Seattle at 46 percent, and Portland at 52 percent. Nationally, the figure is 64 percent. The key factor for the rise in home prices is population growth from 2010 to 2016: the national increase is 4.7 percent, but for these cities, it is 8.2 percent in San Francisco, 9.6 percent in Portland and 15.7 percent in Seattle. A larger population combined with more people working leads to higher home prices."
The National Index is now 3.2 percent higher than its previous peak in July 2006 and has risen by 42.2 percent since hitting bottom in February 2012. The two composites have not yet returned to their respective June 2006 peaks. The 20 City is down by 3.7 percent and the 10 City by 6.2 percent. As of May 2017, average home prices for the MSAs within the 10-City and 20-City Composites are back to their winter 2007 levels.

FHFA HPI
Annual price gains continued unabated according to FHFA's HPI. It posted a 6.9 percent gain for the 12 months ended in May, compared to a 6.8 percent increase in April.
There was, however an easing in the monthly rate of appreciation. The previously reported 0.7 percent March to April gain was revised down to 0.6 percent and May came in at a relatively restrained 0.4 percent.
For the nine census divisions, seasonally adjusted monthly price changes from April 2017 to May 2017 ranged for a decrease of 0.5 percent in the Middle Atlantic division to a 1.0 percent gain in the West South Central division. All divisions posted annual increases. Those ranged from 4.0 percent in the Middle Atlantic to 8.7 in the Pacific region.
Methodology
The S&P CoreLogic Case-Shiller Home Price Indices are constructed to accurately track the price path of typical single-family home pairs for thousands of individual houses from the available universe of arms-length sales data. The National U.S. Home Price Index tracks the value of single-family housing within the United States. The indices have a base value of 100 in January 2000; thus, for example, a current index value of 150 translates to a 50 percent appreciation rate since January 2000 for a typical home located within the subject market.
In addition to the new high in the National Index reported above, the 10- and 20-City Composites had readings of 212.29 and 198.97 respectively. Los Angeles had the highest index reading at 261.83 and Detroit the lowest at 114.37.
FHFA's HPI tracks changes in average home prices by analyzing changes in home values from Fannie Mae- and Freddie Mac-purchased and guaranteed mortgages originated over the past 42 years. The index has a base value of January, 1991=100 and was at 249.2 in May compared to 248.2 in April.


