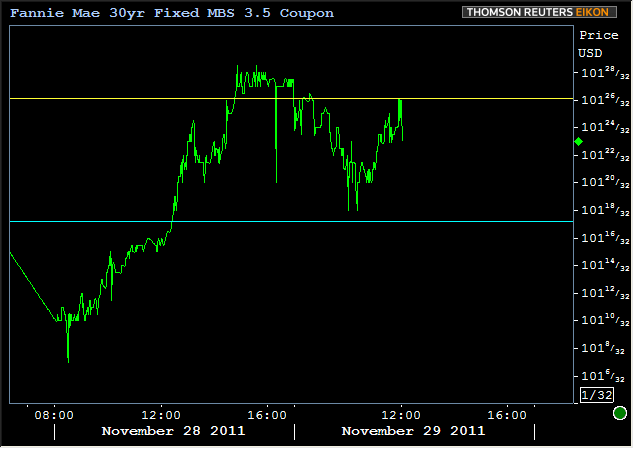
Bond markets are recovering now after losing a bit of ground into the AM hours. None of the movement so far has been enough for a reprice for the worse, but perhaps "close" on a few occasions. Those close calls were the moments during which MBS threatened to break lower past the 101-16 level mentioned yesterday and beyond. Yesterday, we discussed a range in Fannie 3.5's potentially centered on 101-26 (2nd chart after the video in THIS POST). Here's a chart of the past two days of MBS price action with the same lines seen in yesterday's chart, effectively suggesting we're trading the lower half of that range:

The below video from the MBS Live Dashboard shows current MBS and Treasury prices as well as a few of the intraday trends we've been watching on the charts:
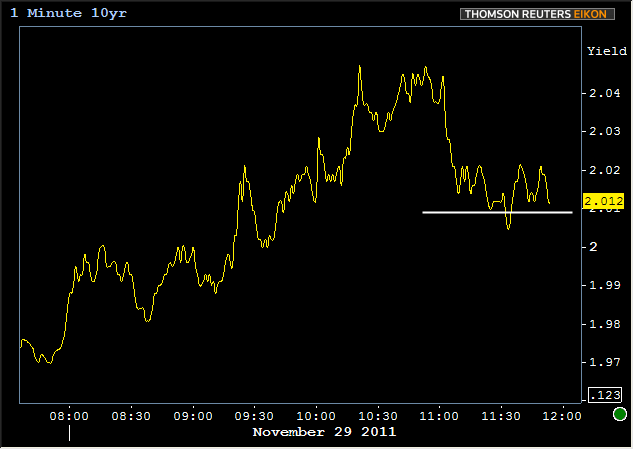
Treasuries have generally been doing a good job of fighting off advancing stock prices (stock lever somewhat disconnected). But the lever is connected enough that further gains in stocks could cause 10yr yields to slip from current support around 2.021 (seen as "the ledge" in the video above). Here's a possible chain of considerations in the broader context:
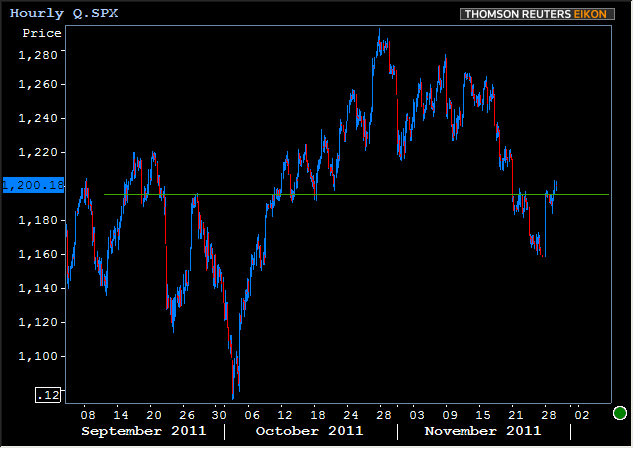
First, note the pivot point discussed yesterday for S&P's:

Then, note how this has played out to offer some support for stocks on a few occasions this morning:

To the extent that stocks show resilience in bouncing there, so too might 10yr yields experience difficulty in breaking lower past 2%. If that difficulty persists , we're back to testing the 2.021 intraday pivot for support:

It's still anyone's game though and 10's remain well within their broader sideways trend between 2.07 and 1.95.


